Service-business websites
Core Web Vitals benchmark of service-business websites by category
We ran Lighthouse on the home pages of 25 service businesses that rank in Google, 5 in each of five categories, on 30 October 2026. The median mobile score was 67. Only 5 met the 2.5-second target for Largest Contentful Paint, and the median was 6.3 seconds. It’s a small lab sample, and the limits are set out below.
By itmarkerz Technologies. Updated 30 October 2026.
The results in one table
| Measure | Result | Sites out of 25 |
|---|---|---|
| Performance score 90 or above (good) | Median score 67 | 3 |
| Performance score 50–89 (needs improvement) | 14 | |
| Performance score under 50 (poor) | 8 | |
| LCP 2.5 s or less (good) | Median 6.3 s | 5 |
| LCP over 2.5 s, up to 4 s | 3 | |
| LCP over 4 s (poor) | 17 | |
| CLS 0.1 or less (good) | Most sites | 19 |
| CLS over 0.25 (poor) | 3 | |
| Both LCP and CLS in the good range | 3 | |
| Server response 800 ms or less | Median 103 ms | 23 |
| Page weight 2 MB or less | Median 2 MB | 12 |
| Page weight over 5 MB | Largest 10.9 MB | 4 |
The thresholds come from Google’s guidance on LCP and CLS, and the score bands from the Lighthouse scoring documentation. The 800 ms server line and the page-weight lines are our own reference points, not official targets. 4 of the CLS values weren’t returned by the testing service. We counted those as good, and the “both” row doesn’t depend on them.
What stands out
The largest element is usually the problem
The gap between the first paint and the largest one is what stands out. The median site showed its first content in 2.2 seconds, but took 6.3 seconds to show the biggest thing on the screen. 17 of the 25 were over 4 seconds. On a service-business home page, that element is often a hero image or video, though we didn’t record which element it was on each site, so check yours.
Servers were rarely to blame
23 of the 25 sites responded within 800 ms, with a median of 103 ms. This number depends on where the test ran and on caching, so it isn’t what every visitor would get. Even so, it suggests buying faster hosting would not have fixed most of these sites. What they load mattered more than where they load it from.
Layout stability was mostly fine
19 sites were in the good range for layout shift, against 5 for loading. 3 were poor, which means content visibly jumped during loading. It’s often among the easier problems to fix, with image dimensions and reserved space for late-loading elements.
Weight matters, but doesn’t decide it
Half the sites were over about 2 MB, and the largest home page weighed 10.9 MB. Heavier pages tended to be slower, but only loosely. One page under 1 MB took more than 5 seconds to show its largest element, while another of nearly 11 MB took less than 5. What loads first matters as well as how much there is.
The platform didn’t tell us much
Lighthouse identified 12 sites as WordPress, 2 as Drupal and 1 as React. It reported nothing for 10, and none as Next.js. The WordPress sites scored from 41 to 98. The 3 sites scoring 90 or more were all WordPress sites running WP Rocket, a caching plugin. Three sites can’t establish cause, but it’s a useful reminder, since we sell both WordPress and Next.js: a site’s platform doesn’t determine its speed.
By category
Read this as a description of these five sites per category, not of each trade. With five sites per row, one result can move a median a long way, and we wouldn’t rank trades on it.
| Category | Median score | Score range | Median LCP | LCP good | CLS good | Median page |
|---|---|---|---|---|---|---|
| Cleaning | 62 | 40–82 | 9 s | 1 of 5 | 5 of 5 | 3 MB |
| Plumbing | 67 | 49–88 | 5.2 s | 1 of 5 | 4 of 5 | 0.9 MB |
| Dental | 48 | 33–77 | 8.8 s | 0 of 5 | 3 of 5 | 2.9 MB |
| Accounting | 72 | 60–98 | 4.3 s | 1 of 5 | 5 of 5 | 1.9 MB |
| Electrical | 70 | 47–96 | 5.4 s | 2 of 5 | 2 of 5 | 1.2 MB |
Every site, anonymised
Sites are numbered by score within each category. The numbering has nothing to do with search position.
| Site | Score | LCP | CLS | TBT | Server response | Page |
|---|---|---|---|---|---|---|
| Cleaning 1 | 82 | 2.2 s | 0.028 | 664 ms | 75 ms | 1.2 MB |
| Cleaning 2 | 73 | 10.6 s | 0.000 | not returned | 141 ms | 6.6 MB |
| Cleaning 3 | 62 | 16.2 s | 0.029 | 238 ms | 250 ms | 3 MB |
| Cleaning 4 | 45 | 7.2 s | 0.017 | 790 ms | 289 ms | 1.4 MB |
| Cleaning 5 | 40 | 9 s | not returned | 1,835 ms | 26 ms | 4.5 MB |
| Plumbing 1 | 88 | 2.3 s | 0.183 | 34 ms | 13 ms | 0.9 MB |
| Plumbing 2 | 75 | 6.3 s | 0.002 | 174 ms | 12 ms | 0.8 MB |
| Plumbing 3 | 67 | 5.2 s | 0.000 | 315 ms | 235 ms | 3.6 MB |
| Plumbing 4 | 65 | 3 s | not returned | 1,957 ms | 97 ms | 0.8 MB |
| Plumbing 5 | 49 | 10 s | 0.033 | 968 ms | 81 ms | 5.4 MB |
| Dental 1 | 77 | 2.6 s | 0.156 | 448 ms | 179 ms | 5.9 MB |
| Dental 2 | 67 | 4.8 s | 0.079 | 415 ms | 49 ms | 10.9 MB |
| Dental 3 | 48 | 8.8 s | not returned | 797 ms | 206 ms | 2.2 MB |
| Dental 4 | 41 | 16.4 s | 0.019 | 967 ms | 607 ms | 2.9 MB |
| Dental 5 | 33 | 11.2 s | 0.350 | 626 ms | 103 ms | 2 MB |
| Accounting 1 | 98 | 2.3 s | 0.011 | not returned | 71 ms | 0.8 MB |
| Accounting 2 | 80 | 4.3 s | 0.005 | 188 ms | 100 ms | 0.7 MB |
| Accounting 3 | 72 | 9.3 s | not returned | 17 ms | 78 ms | 1.9 MB |
| Accounting 4 | 65 | 6.9 s | 0.011 | 309 ms | 64 ms | 5 MB |
| Accounting 5 | 60 | 3.2 s | 0.000 | 3,577 ms | 131 ms | 3.2 MB |
| Electrical 1 | 96 | 2 s | 0.114 | not returned | 500 ms | 1.2 MB |
| Electrical 2 | 93 | 2.5 s | 0.002 | 32 ms | 1,583 ms | 0.7 MB |
| Electrical 3 | 70 | 11.6 s | 0.025 | 250 ms | 66 ms | 1.5 MB |
| Electrical 4 | 48 | 18.9 s | 0.414 | 120 ms | 1,290 ms | 3.3 MB |
| Electrical 5 | 47 | 5.4 s | 1.015 | not returned | 523 ms | 0.9 MB |
TBT is Total Blocking Time, the time the page was too busy to respond during loading. It’s a lab measure and not a Core Web Vital. “Not returned” means the testing service left the value out of its response. We show that rather than guess.
The method
- Categories. Five common local service types, chosen by us: cleaning, plumbing, dental, accounting and electrical.
- Selection. On 30 October 2026 we pulled Google’s mobile results through the DataForSEO SERP API, for one search in one city per category (table below). We took the first five organic results, in order, that were a business’s own website, and tested each site’s home page.
- Exclusions. Directories, marketplaces, review and list articles, job boards, trade associations, social media and paid results. We didn’t remove any site for scoring badly, and we didn’t replace any site after testing it. All 25 tests completed.
- Test. Lighthouse 13.4.0, performance category only, run through DataForSEO’s hosted Lighthouse service with the mobile setup: an emulated Moto G Power, simulated throttling at 150 ms round-trip time and about 1.6 Mbps, and a 4× CPU slowdown. A few tests ran at a time.
- Runs. One run per site, which is the number in every table. We repeated 5 sites, one per category, to see how much a result moves. We report the first run, whichever was better.
| Category | Search | Location set for the search |
|---|---|---|
| Cleaning | cleaning company perth | Perth, Australia |
| Plumbing | plumber manchester | Manchester, UK |
| Dental | dentist austin | Austin, US |
| Accounting | accountants leeds | Leeds, UK |
| Electrical | electrician denver | Denver, US |
How much to trust this
Single runs move a lot. The Lighthouse documentation says scores fluctuate and are better seen as a distribution. Our repeats, run later the same day, agree:
| Repeated site | Score, first run | Score, second run | LCP, first run | LCP, second run |
|---|---|---|---|---|
| Repeat 1 | 45 | 76 | 7.2 s | 4 s |
| Repeat 2 | 65 | 92 | 3 s | 2.8 s |
| Repeat 3 | 41 | 45 | 16.4 s | 8.4 s |
| Repeat 4 | 60 | 55 | 3.2 s | 7.3 s |
| Repeat 5 | 96 | 96 | 2 s | 2 s |
One site’s score moved by more than 30 points, and on two sites LCP roughly doubled or halved. So don’t read much into any one row of the site table. The overall pattern is sturdier, but it comes from single runs as well.
The other limits are these.
- It’s lab data. It simulates one mid-range phone on one slow connection. Real visitors vary, and Google assesses Core Web Vitals at the 75th percentile of real page loads.
- INP isn’t measured. Interaction to Next Paint needs real interactions. Google’s article says TBT can serve as a proxy but isn’t a substitute, so we make no claim about INP.
- It’s a small sample, and not a random one. 25 sites, chosen because they already rank in one city each. Some are larger firms, so this isn’t a picture of all small businesses.
- Home pages only. Someone from search often lands on a service page, and those can behave differently.
- One day. A site can change the next day, and this result won’t follow it.
- We don’t know where the test server sits. The service doesn’t say, which is one reason server response may not match what a local visitor gets.
- Field data is missing. We wanted to add Chrome real-user data as well, but Google’s public PageSpeed Insights API was rate-limiting us, so we didn’t. Many small sites may have none anyway, because the Chrome UX Report only includes sufficiently popular pages and origins.
Results we threw away. We first ran Lighthouse on our own computer, using Edge, while it was busy with other work. The first five completed runs all scored between 24 and 27, which looked wrong. One of those sites scored 25 there with LCP at 10.8 seconds, and 60 with LCP at 3.2 seconds on the hosted service. The machine was the problem, so we discarded those runs and used none of them here.
What each number means
Largest Contentful Paint is when the biggest visible image or block of text appears, and it’s the closest of these to “when does the page look ready?”. Cumulative Layout Shift measures how much things jump around while the page loads, the effect that makes you tap the wrong button. Total Blocking Time is how long the browser was too busy to respond while loading.
The performance score blends these. The Lighthouse documentation weights Total Blocking Time at 30%, LCP and CLS at 25% each, and First Contentful Paint and Speed Index at 10% each. That’s why the score and LCP don’t always agree in the site table: one page here with LCP over 4 seconds scored 80, while two with LCP near 3 seconds scored in the 60s, with heavy blocking time on each. For a business owner, LCP is the more useful number to watch, and the score is the quick summary.
What would make this better
A stronger version would use more sites per category, three or more runs per site, service pages as well as home pages, and real-user data where it exists. If we repeat it, we’ll publish it as a new dated test and keep this one as it is, rather than quietly changing the numbers. If you run a similar test and get different results, we’d like to hear about it.
Check your own site the same way
- Open PageSpeed Insights and enter your home page and your busiest service page.
- Look at the mobile result. If it shows real-user data at the top, that is the one to trust. It’s the closest thing to what Google uses.
- Run the lab test three times and take the middle result, because of the noise shown above.
- Compare with this page’s medians: score 67, LCP 6.3 seconds, page weight 2 MB. Beating those means you’re ahead of these ranking sites on one lab test. It doesn’t mean you’re done, since the target is 2.5 seconds.
- Find what Lighthouse names as the LCP element. If it’s an image or a video, that’s your first job.
Our post on how fast a small-business website should be turns this into targets and an order of work. A faster page helps only if the rest of the site does its job, so see also what a cleaning website needs to get quotes and the local SEO checklist.
Service-business sites we have built
Next.js lead-generation website for a Perth cleaning-services company: quote capture with export and email, Google Business Profile, GA4 and Search Console, ongoing local SEO.
- Sector
- Cleaning & facility services
- Region
- Australia
- Stack
- Next.js
- Engagement
- Website build and ongoing SEO
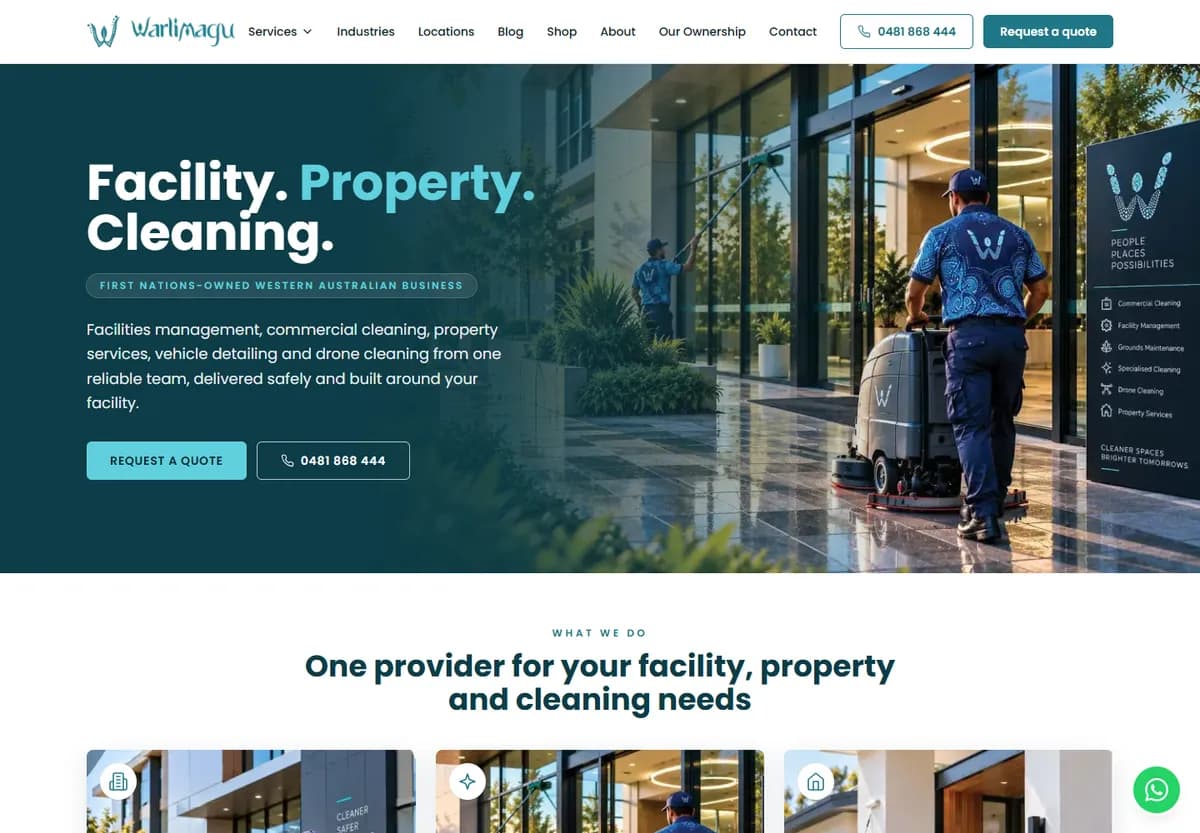
An Aboriginal-owned facilities, property and cleaning services business in Western Australia. Next.js website: enquiry capture with export and email, Google Business Profile, GA4 and Search Console, ongoing local SEO.
- Sector
- Cleaning & facility services
- Region
- Australia
- Stack
- Next.js
- Engagement
- Website build and ongoing SEO

Questions
Does this show which trade has the slowest websites?
No. There are 5 sites in each category, each from one search in one city. The differences between categories are smaller than the differences within them, and the repeat runs show single results moving a lot. Treat the category rows as a description of these sites only.
Why don’t you name the sites?
The point is the pattern, not embarrassing small businesses over a single test on a single day. The sites are numbered by score within each category, and the search and location we used are published, so you can run the same method yourself.
Did these sites pass Core Web Vitals?
We can’t say. A real pass is judged on Chrome users’ field data at the 75th percentile, and includes Interaction to Next Paint, which a page-load test like this doesn’t measure. We compare lab results with the published thresholds only as a yardstick.
Did you include sites you built?
Neither of the cleaning sites we built, Xavis Cleaning and Warlimagu, appeared among the sites selected, so they aren’t in these results. We didn’t add them, because choosing to add our own work would undermine the sample.
More on service-business websites
- How fast should a small-business website be?The targets that matter, and what our test sample actually reached.
- Next.js or WordPress for a service-business website?We build and look after both. How to choose by who will run the site.
- What a cleaning-company website needs to get quotesTwo sites we built, and the parts that do the work.
- Local SEO setup checklist for a new websiteWhat to set up before launch, in the first week and in the first month.
Want your site measured the same way?
Send us the address. We will tell you what is slowing it down and which fix to make first.
We reply within one business day (IST).